


10 Data Driven Marketing Strategies to Scale Growth in 2026

In today's competitive market, hoping your marketing works is a recipe for wasted ad spend and stagnant growth. The most successful brands are not just creative; they are calculated, using data to understand customer behavior, predict future trends, and make every marketing dollar accountable. This foundational shift underscores the importance of Data Driven Decision Making for E-commerce Success, moving businesses away from intuition towards verifiable insights.
This shift from gut-feel to data-backed decisions is the core of modern growth. We are moving beyond basic analytics into a world of predictive modeling, real-time optimization, and hyper-personalized customer journeys. It is the difference between casting a wide, expensive net and using a precise, cost-effective spear. For any business aiming to scale, implementing effective data driven marketing strategies is no longer a competitive advantage; it is a fundamental requirement for survival and profitability.
This article breaks down 10 powerful data driven marketing strategies designed to transform your campaigns from a cost center into a predictable revenue engine. Forget generic advice. Instead, you will find a clear blueprint for action. We will provide practical examples, step-by-step implementation tips, and key metrics for businesses of all types, from e-commerce stores and local service providers to multi-location franchises and expert coaches. Prepare to turn raw information into measurable impact and make smarter decisions that drive real results.
1. Predictive Analytics & Customer Segmentation
Predictive analytics moves beyond analyzing past events and instead uses historical data, statistical algorithms, and machine learning techniques to forecast future outcomes. For marketers, this means anticipating customer behavior, identifying high-value audience segments, and predicting key metrics like customer lifetime value (LTV). This data-driven marketing strategy allows businesses to focus their resources on audiences with the highest probability of converting, dramatically improving return on ad spend (ROAS).

This approach enables the creation of micro-personas based not just on demographics, but on tangible behaviors like purchase frequency, browsing patterns, and product affinities. Instead of targeting "women aged 25-40," you can target "customers likely to purchase a second time within 30 days" or "users at high risk of churning." The result is hyper-personalized messaging that speaks directly to each group's specific needs and motivations. You can explore a variety of advanced audience segmentation strategies to build on these predictive insights.
Practical Implementation & Examples
- E-commerce: A fashion retailer's data shows that customers who buy a specific brand of jeans are 75% more likely to purchase a leather jacket within 60 days. The marketing team creates a predictive segment for "Recent Jean Buyers" and serves them targeted ads and emails showcasing the new jacket collection, leading to a significant uplift in cross-sells.
- SaaS Platforms: A B2B software company analyzes usage data and identifies a pattern: accounts that integrate with both Slack and Google Drive within their first 14 days have a 90% retention rate. They create an onboarding email sequence specifically for new users who haven't connected these apps, guiding them through the process to proactively reduce churn.
- Local Services: A multi-location gym franchise uses past attendance data to predict which members are at risk of canceling their subscriptions based on a declining check-in frequency over a 3-week period. The system automatically triggers a re-engagement text message offering a free personal training session to these members, preventing churn.
Actionable Tips for Getting Started
- Start with Clean Data: Use your most reliable datasets, such as purchase history and email engagement, as the foundation for your predictive models.
- Validate Before Scaling: Test your model's predictions on a small, controlled audience segment to verify its accuracy before launching a full-scale campaign.
- Integrate with Ad Platforms: Upload lists of high-value predictive segments to Google or Facebook to build powerful lookalike audiences, finding new customers who mirror your best ones.
- Use Embedded Tools: Small businesses can start without a data scientist. Platforms like HubSpot and Segment offer built-in predictive lead scoring and segmentation features that make this strategy accessible.
2. Real-Time ROAS Optimization & Attribution Modeling
This data-driven marketing strategy focuses on two connected goals: continuously allocating budget to the most profitable activities in real time and accurately understanding which touchpoints drive revenue. By combining ROAS (Return on Ad Spend) optimization with advanced attribution, businesses move beyond guesswork. Instead of waiting weeks to analyze results, they can automatically shift funds to top-performing ads, audience segments, and channels as performance data comes in, maximizing profitability.
This approach rejects simplistic last-click attribution, which incorrectly gives 100% of the credit to the final touchpoint before a conversion. Instead, sophisticated attribution modeling assigns value across the entire customer journey, from the first social media ad a user saw to the final branded search that led to a purchase. It provides a clear, evidence-based picture of how different channels work together, justifying spend and revealing hidden opportunities for growth. To dig deeper into how this works, you can read more about what multi-touch attribution truly entails.
Practical Implementation & Examples
- E-commerce: A Shopify store uses an attribution tool like Northbeam and sees that while Facebook Ads are great for introducing the brand (first touch), Google Shopping ads are responsible for closing most sales (last touch). Armed with this data, they stop judging Facebook's ROI on direct sales alone and confidently fund it as a critical top-of-funnel channel, while optimizing Google Shopping for conversion efficiency.
- Coaches & Consultants: An online business coach uses marketing automation to track leads. They discover that leads who first watch a YouTube video, then attend a webinar, and finally click an email link are 5x more likely to buy their high-ticket program. This insight proves the value of their video content, justifying more investment in their YouTube channel.
- Local Services: A dental clinic integrates its booking system with Google Ads. They find that the keyword "emergency root canal" generates high-cost leads but low-profit appointments, while "cosmetic veneers cost" has a lower click-through rate but leads to high-value patients. They reallocate their ad budget from emergency services to cosmetic keywords, dramatically increasing practice revenue.
Actionable Tips for Getting Started
- Standardize UTM Parameters: Create and enforce a consistent UTM tagging structure for every link across every campaign. This is the foundation for clean attribution data.
- Prioritize First-Party Data: Use your own CRM, email platform, and e-commerce data as the primary source of truth, as it's more reliable than pixel-based data from ad platforms.
- Set Up Conversion Value Tracking: In Google Ads and Meta Ads, assign dynamic monetary values to conversions. This allows you to optimize for actual revenue, not just lead volume.
- Create a Unified Dashboard: Use a tool like Google Looker Studio or Databox to pull data from all your marketing platforms into a single view for clear, cross-channel ROAS analysis.
3. Conversion Rate Optimization (CRO) & A/B Testing Frameworks
Conversion Rate Optimization (CRO) is the systematic process of improving your website and marketing funnels to increase the percentage of visitors who take a desired action. Instead of paying more for traffic, CRO focuses on getting more value from the traffic you already have. This data-driven marketing strategy uses A/B testing, multivariate testing, and user behavior analysis to identify friction points and test hypotheses, creating compounding gains that directly increase revenue and ROAS.

The core of CRO is a disciplined, data-first approach to understanding why users aren't converting and then methodically testing changes to fix those issues. By analyzing heatmaps, session recordings, and funnel analytics, marketers can move from guesswork to informed decisions. This leads to higher-performing landing pages, more effective email campaigns, and smoother checkout flows. For a complete guide to implementing these tactics on your e-commerce site, check out this resource on Conversion Rate Optimization Shopify.
Practical Implementation & Examples
- E-commerce: An online store uses a heatmap tool like Hotjar and discovers that 70% of mobile users drop off on the product page. They notice users are not scrolling down to the "Add to Cart" button. They A/B test a new page layout with a "sticky" Add to Cart button that is always visible on the screen. The new version increases mobile conversions by 22%.
- SaaS Platforms: A software company wants to increase demo signups. Their analytics show the pricing page has a high exit rate. They form a hypothesis that their pricing is unclear. They test a simplified, three-tier pricing table against their original complex one. The new, clearer pricing page increases demo requests by 40%.
- Coaches & Consultants: A business coach A/B tests the subject line of an email promoting their webinar. Version A is "Join My Upcoming Webinar." Version B is "Learn the 3 Mistakes Costing Your Business $10k/Month." Version B achieves a 50% higher open rate and drives twice as many registrations, proving that benefit-driven copy is more effective.
Actionable Tips for Getting Started
- Analyze Behavior First: Before building tests, use heatmaps and session recordings to understand what users are actually doing on your key pages.
- Apply the 80/20 Rule: Prioritize testing on your highest-traffic pages first. Small improvements on a page with 10,000 visitors a month will have a much bigger impact than a big win on a page with 100 visitors.
- Isolate Your Variables: Test one significant element at a time (e.g., the headline or the call-to-action button color) to know exactly what caused the change in performance.
- Document Everything: Maintain a CRO scorecard or log to track every test, its hypothesis, the results, and what you learned. This document becomes an invaluable asset for planning future tests.
4. Behavioral Email Sequencing & Automation
Behavioral email automation sends messages triggered by specific user actions, such as an abandoned cart, a recent purchase, or a content download, rather than broadcasting on a fixed schedule. This data-driven marketing strategy connects customer data with real-time behavioral triggers to deliver highly relevant, personalized messages that nurture leads and drive sales at scale. It ensures each person receives content pertinent to their current stage in the customer lifecycle, leading to significantly higher engagement and revenue per email.
Moving beyond generic newsletters, this approach allows you to build automated conversations that respond directly to customer intent. Instead of sending one mass email about a new product line, you can send a targeted follow-up to users who viewed a specific product category three times but didn't buy. This transforms email from a simple broadcast tool into a dynamic, one-to-one communication channel that builds trust and guides customers toward their next logical action.
Practical Implementation & Examples
- E-commerce: A customer buys a new camera from an online electronics store. This action triggers a 3-part automated email sequence. Day 1: A "thank you" email with a link to a video tutorial on setting up the camera. Day 7: An email showcasing compatible accessories like lenses and tripods. Day 30: An email asking for a product review in exchange for a 10% discount on their next purchase.
- Coaches & Consultants: Someone downloads a "Business Growth Checklist" from a consultant's website. This triggers a nurture sequence. The first email delivers the checklist. Three days later, a second email shares a case study of a client who used the checklist to succeed. A week later, a third email invites them to a free webinar that expands on one of the checklist's key points, moving them deeper into the sales funnel.
- Service Businesses: A dental clinic's system automatically identifies patients who haven't booked a cleaning in over 7 months. This triggers a friendly reminder email. If they don't book within two weeks, a second email is sent with a small discount for booking their cleaning online. This automated process increases patient retention and fills the clinic's schedule.
Actionable Tips for Getting Started
- Map Key Journey Points: Identify critical decision moments in your customer journey (e.g., first purchase, cart abandonment, subscription renewal) and build an automated sequence for each.
- Segment by Purchase History: Create distinct email paths for different customer types. New customers should receive educational content and welcome offers, while repeat buyers get access to VIP perks and new arrivals.
- Use Dynamic Content: Incorporate product recommendation blocks that populate based on a user's browsing or purchase history, making each email feel uniquely personalized.
- Monitor Engagement Closely: Watch your open rates, click-through rates, and unsubscribe rates for each sequence. If engagement drops sharply after a specific email, pause the automation and re-evaluate that message's content and timing.
5. Geofencing & Location-Based Targeting
Geofencing marketing creates virtual boundaries around real-world locations, using GPS and mobile data to trigger ads when a user enters or exits a defined zone. This data-driven marketing strategy moves beyond broad zip code targeting to deliver contextually relevant messages based on a user’s immediate physical surroundings. For businesses with physical locations, it’s a powerful tool to drive foot traffic, intercept competitor customers, and connect digital ads to in-store sales.
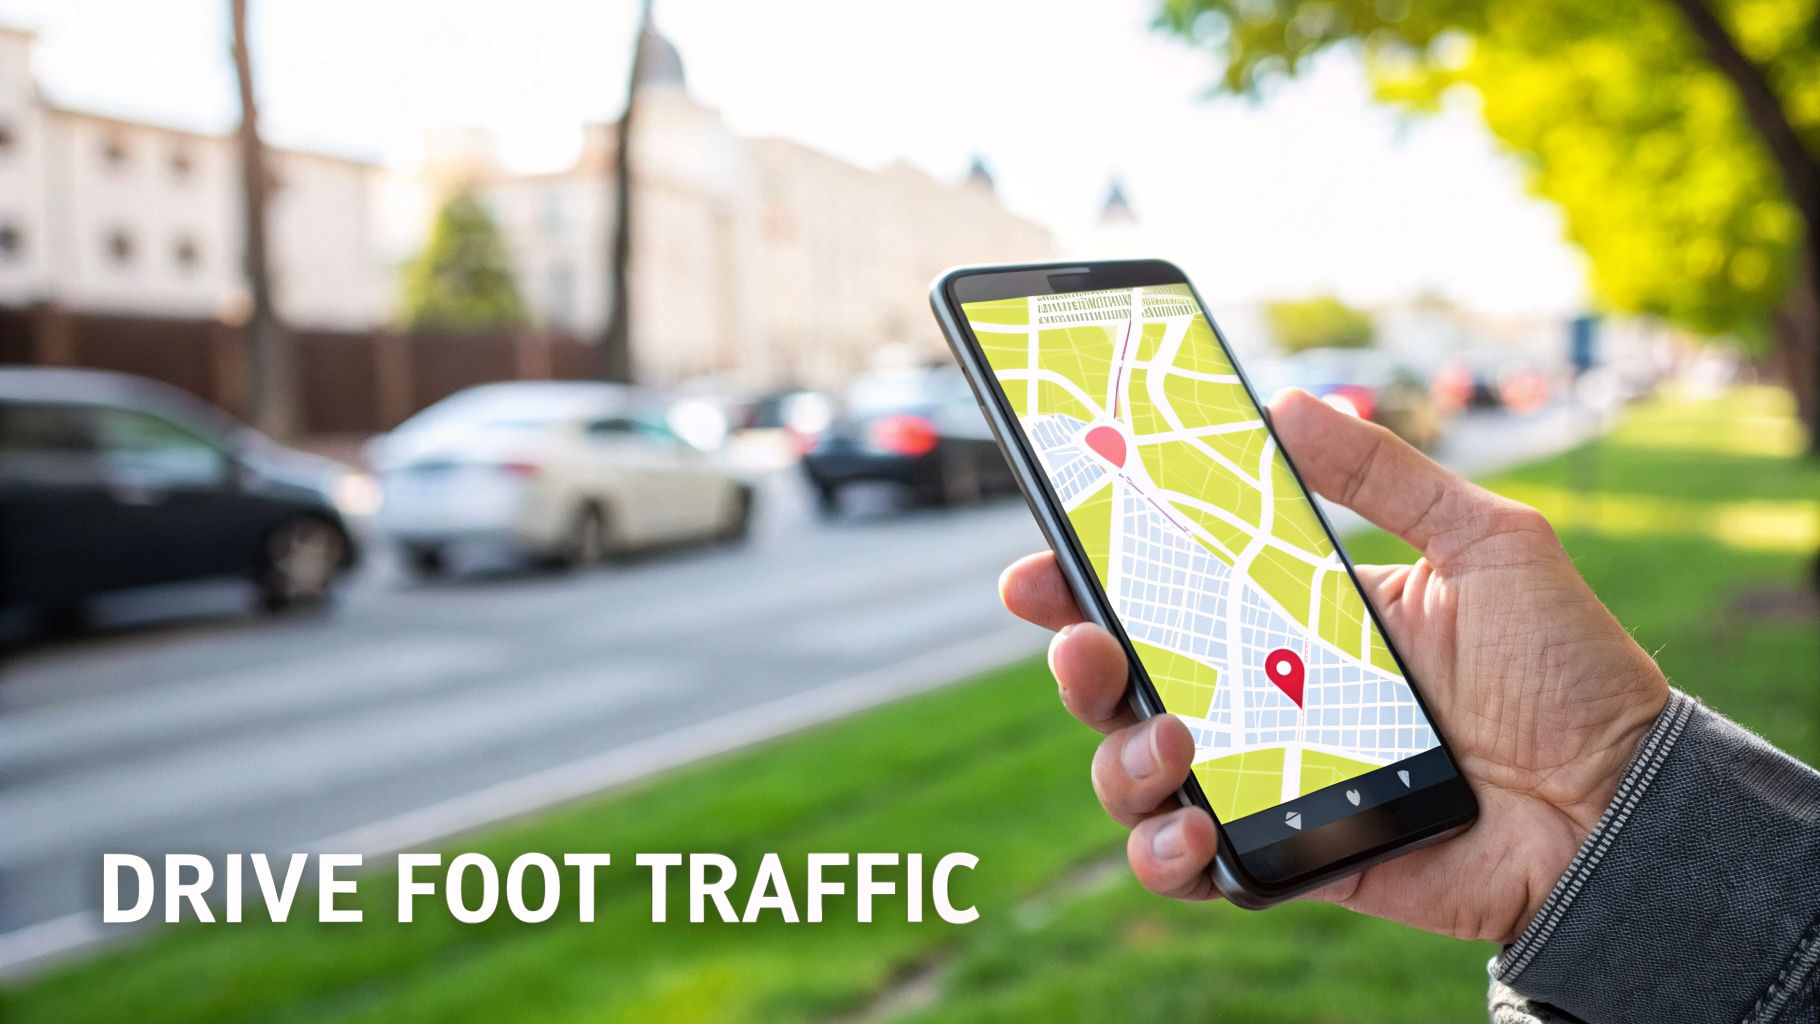
The real power of geofencing comes from layering location data with behavioral signals and audience segments. Instead of just targeting everyone near your store, you can target users who have visited competitor locations, attended a specific industry event, or live in affluent neighborhoods. This allows local service businesses, multi-location retailers, and franchises to deliver hyper-specific offers that prompt immediate action, bridging the gap between online advertising and offline conversions.
Practical Implementation & Examples
- Local Services (Competitor Conquesting): A personal injury law firm sets up a geofence around local hospitals and auto repair shops. When someone's device is detected in one of these locations for an extended time, they are served a mobile ad saying, "Injured in an accident? Get a free consultation today." This targets individuals at their precise moment of need.
- Retail & Restaurants: A fast-casual restaurant chain creates a geofence around its main competitor's locations. When a user enters the competitor's zone, they receive a push notification or social media ad with a coupon for a free drink at the chain's nearby restaurant, directly incentivizing them to switch.
- Real Estate: An agent hosting an open house sets a geofence around the property. They serve ads to anyone who attended, retargeting them over the next 7 days with ads for similar listings and a call-to-action to schedule a private tour. This keeps their listings top-of-mind with active, local buyers.
Actionable Tips for Getting Started
- Prioritize Competitor Conquesting: Start by setting geofences around your direct competitors' locations. This is often the highest-return tactic, as you are reaching customers with demonstrated purchase intent.
- Adjust Your Radius: Use smaller geofences (200-500 feet) for dense urban areas like a city block and larger ones (0.5-1 mile) for suburban or lower-density locations to ensure adequate audience size.
- Layer with Search Intent: Combine your geofence audience with retargeting lists from Google Ads. Show specific ads to users who were in your target zone and have recently searched for your services.
- Measure Foot Traffic: Use platforms with cross-device attribution tools to measure "store visits" or "foot traffic lift." This metric directly connects your digital ad spend to real-world customer actions.
6. Customer Lifetime Value (LTV) Modeling & Unit Economics Optimization
LTV modeling calculates the total profit a business expects from a single customer over their entire relationship. This data-driven marketing strategy shifts the focus from short-term conversions to long-term profitability. By understanding LTV, marketers can confidently determine how much to spend on customer acquisition costs (CAC), identify their most valuable segments, and make smarter decisions about retention efforts and pricing. It provides the financial framework to separate sustainable, profitable growth from simply acquiring unprofitable customers.
This approach allows you to connect marketing spend directly to long-term revenue. Instead of just measuring cost-per-click, you can answer critical questions like, "Which advertising channel produces our most loyal customers?" or "How much can we afford to spend to acquire a customer from a specific campaign?" Knowing the lifetime value of customers acquired through different funnels empowers you to allocate your budget with surgical precision, investing more in channels that deliver sustained value.
Practical Implementation & Examples
- E-commerce: A direct-to-consumer coffee brand calculates that customers acquired via a referral program have a 2x higher LTV ($250) than those acquired from Facebook ads ($125). This data justifies increasing the referral bonus from $10 to $20, as the long-term profit from these high-value customers far outweighs the increased acquisition cost.
- SaaS Platforms: A subscription software company discovers through cohort analysis that customers who adopt their "reporting" feature within the first 30 days have an LTV that is 40% higher than average. In response, they create a dedicated onboarding campaign and in-app tutorials focused on driving adoption of that specific feature to boost overall LTV.
- Coaching & Consulting: A business coach finds that clients who start with their $997 group program have a lifetime value of $7,500 because 30% of them upgrade to a $25,000 mastermind. This insight allows them to confidently spend up to $1,000 to acquire a new group program client, a number that would seem unprofitable without LTV data.
Actionable Tips for Getting Started
- Calculate LTV by Channel: Track LTV based on the customer's first acquisition source (e.g., Facebook Ad, Google Search, organic referral). This reveals the true ROI of each marketing channel, which is often hidden by last-click attribution.
- Focus on the LTV:CAC Ratio: Consistently measure your LTV to Customer Acquisition Cost ratio. A healthy business model typically aims for a ratio of 3:1 or higher, meaning a customer generates at least three times their acquisition cost in value.
- Perform Cohort Analysis: Group customers by their sign-up month (e.g., January cohort, February cohort) and compare their LTV over time. This helps you understand if changes to your product or marketing are improving customer value.
- Guide Retention Spending: Use LTV to justify investments in customer retention. If a customer segment has an LTV of $500 but shows a high churn rate, investing $50 in a re-engagement offer or loyalty program becomes an obvious and profitable decision.
7. Dynamic Creative Optimization (DCO) & AI-Powered Ad Variations
Dynamic Creative Optimization (DCO) automates the creation and testing of ad components like headlines, images, and calls to action. Instead of a marketer manually building a few ad versions, DCO uses machine learning to assemble and deploy hundreds or even thousands of combinations in real time. The system continuously analyzes performance data to identify which creative elements resonate most effectively with specific audience segments, automatically scaling the winning variations. This data-driven marketing strategy moves beyond A/B testing to achieve a state of constant, automated ad improvement.
This approach allows algorithms to discover non-obvious connections between creative elements and audience responses. The system might find that a particular headline combined with a specific image performs best for users in one city, while a different combination works for another. This leads to more relevant ad experiences, lower customer acquisition costs (CAC), and higher conversion rates, as the platform learns from every impression and click.
Practical Implementation & Examples
- E-commerce: A travel company running Facebook ads uploads 10 different images (beaches, mountains, cities), 5 headlines (e.g., "Escape the Ordinary," "Your Dream Vacation Awaits"), and 3 calls to action (e.g., "Book Now," "Learn More"). Facebook's DCO automatically shows a beach image with the "Book Now" button to users who previously engaged with tropical content, while showing a mountain image and "Learn More" to a different audience segment, personalizing ads at scale.
- Coaches & Consultants: A business coach uses Google's Performance Max campaign to promote a webinar. They provide several video testimonials, text-based headlines about business growth, and images of their live events. The AI discovers that video testimonials paired with headlines mentioning "scaling to 7 figures" perform best on YouTube, but static images with headlines about "avoiding burnout" perform better on the Google Display Network, optimizing creative for each placement automatically.
- Local Services: A national pizza franchise uses DCO to create localized ads. They upload a standard set of pizza images and headlines but use a dynamic feed to insert the local store's address and a specific local promotion (e.g., "Two for Tuesday in Austin"). The system automatically builds thousands of ad variations, each tailored to a specific franchise location.
Actionable Tips for Getting Started
- Provide Sufficient Assets: Feed the DCO platform with a minimum of 3-5 distinct image/video options, 3-5 headlines, and 3-5 body copy variations to give the algorithm enough material to test.
- Monitor Asset Performance: Check your ad platform's reporting weekly to identify consistently underperforming creative assets (images, headlines) and pause or replace them.
- Apply DCO Learnings: Analyze which AI-generated combinations perform best. Use these insights to inform the design and copy of your static, hand-crafted ads and landing pages.
- Combine with Audience Targeting: For maximum impact, pair DCO with well-defined audience segments. While AI can optimize audience selection, providing a strong starting point (like a retargeting list) often yields better results.
8. Omnichannel Attribution & Customer Journey Mapping
Omnichannel attribution connects customer touchpoints across all marketing channels into a unified view of the customer journey. Rather than giving all the credit to the last click, this approach maps how each touchpoint contributes to a conversion. It reveals whether a social media ad built initial awareness, an email campaign drove consideration, or a Google search closed the deal. This strategy helps you move beyond siloed channel optimization and build a cohesive, sequential marketing plan that guides customers toward a purchase.
This data-driven marketing strategy provides a complete picture of your funnel, showing how different channels work together. For instance, you might discover that your Facebook ads don’t generate many direct sales but are critical for introducing your brand to new audiences who later convert through search ads. This insight justifies continued investment in top-of-funnel channels that might otherwise appear to have a low direct return on investment.
Practical Implementation & Examples
- E-commerce: Using a tool like Segment, an online retailer maps a typical high-value customer journey: 1) Sees a TikTok video ad. 2) Clicks the ad but doesn't buy. 3) Two days later, receives a retargeting ad on Instagram. 4) Clicks the Instagram ad and abandons their cart. 5) The next day, receives an abandoned cart email with a 10% discount. 6) Clicks the email and completes the purchase. This map proves that TikTok, Instagram, and email are all essential and should be funded collaboratively.
- Coaches & Consultants: A business coach maps their sales funnel and realizes that their podcast listeners convert to high-ticket clients at a 3x higher rate than their social media followers. While the podcast generates fewer leads, the quality is far superior. This insight leads them to invest more in podcast guesting and promotion, focusing on quality over quantity.
- Local Services: A local med spa runs a TV ad campaign. Their journey map, powered by their CRM, shows a clear pattern: during the week the TV ad airs, branded Google searches for "[Spa Name] near me" increase by 300%, and website appointment bookings from organic search triple. This directly links the offline TV spend to a measurable increase in online, high-intent actions.
Actionable Tips for Getting Started
- Map Your Ideal Journey First: Before you set up tracking, outline the ideal path you want a customer to take from discovery to purchase. This will guide your technical implementation.
- Use Consistent UTM Parameters: Tag all your campaign URLs with clear and consistent UTMs to accurately distinguish traffic sources, campaigns, and content within your analytics platform.
- Implement a Customer ID System: Use tools like Google Analytics 4 or a CRM to connect user behavior across devices and sessions. This links anonymous browsing activity to a known customer profile once they provide an email or phone number.
- Set an Appropriate Attribution Window: For fast-moving consumer goods, a 30-day window might be sufficient. For high-ticket services or B2B sales, a 90-day or longer window is more realistic for capturing the full journey.
9. Competitive Intelligence & Market Share Analytics
Competitive intelligence moves your strategy from reactive to proactive. This approach gathers and analyzes data on competitor strategies, messaging, pricing, and campaign performance to reveal gaps and opportunities in the market. By systematically reviewing competitor ads, landing pages, and social content with tools like Semrush and SpyFu, you can reverse-engineer what works and avoid costly trial-and-error. This is one of the most direct data-driven marketing strategies for accelerating growth by learning from the successes and failures of others in your space.
This method allows you to benchmark your performance and make informed decisions about resource allocation. Instead of guessing which new channel to test, you can see where your top competitors are increasing their ad spend, signaling a profitable avenue. It also helps you differentiate your messaging by identifying the customer pain points your rivals are either ignoring or addressing poorly. You can get a detailed breakdown of competitive traffic sources and audience engagement using platforms like SimilarWeb.
Practical Implementation & Examples
- E-commerce: A Shopify store selling skincare products uses a tool like the Meta Ad Library to analyze 20 competitors' ad campaigns. They notice that the top 3 brands are heavily promoting products with Vitamin C and using "brightening" in their ad copy. This market data validates their plan to launch a new Vitamin C serum and informs the keywords they use in their campaign.
- Coaches & Consultants: A business coach uses Semrush to analyze their top competitor's organic traffic. They find that a single blog post, "How to Structure a Sales Team," accounts for 30% of their rival's website visitors. This prompts them to create a more comprehensive "Ultimate Guide to Building a Sales Team," complete with a downloadable template, to capture a share of that valuable traffic.
- Local Services: A medical spa manually tracks the monthly promotions of all local competitors in a spreadsheet. They observe that no competitor offers a discount on laser hair removal in January. They strategically launch a "New Year, New You" laser hair removal package in January, capturing market share during a period when their rivals are focused elsewhere.
Actionable Tips for Getting Started
- Create a Tracking Dashboard: Monitor 3-5 key competitors monthly, tracking metrics like ad spend estimates, top keywords, new ad creatives, and social media engagement.
- Analyze Indirect Competitors: Look beyond businesses offering the same service. Analyze those solving the same core customer problem with a different solution to uncover fresh marketing angles.
- Map Messaging Pillars: Document the main value propositions your competitors use in their copy. This helps you find a unique position and ensure you address critical customer concerns they might be missing.
- Look for Channel Gaps: If no one in your industry is advertising on a specific platform like podcasts or TikTok, it could be an underexploited opportunity with lower ad costs.
10. Marketing Mix Modeling (MMM) & Budget Optimization
Marketing Mix Modeling (MMM) uses statistical analysis to measure the impact of various marketing activities on sales. Unlike user-level attribution models that track clicks and conversions, MMM takes a top-down view, analyzing aggregate data like weekly channel spend and total sales revenue over time. This data-driven marketing strategy quantifies the contribution of each channel, both online and offline, to your bottom line, helping you understand the true ROI of your complete marketing ecosystem.
This holistic perspective reveals how different channels work together and uncovers the point of diminishing returns for each. For businesses with complex customer journeys that span digital ads, in-store visits, and traditional media, MMM provides a clear picture of what is truly driving growth. It answers the crucial question: "If I invest another dollar, where should it go to get the highest return?" This strategic insight is essential for effective budget allocation, especially when you need to justify spending on channels with less direct tracking, like TV or print.
Practical Implementation & Examples
- E-commerce: A direct-to-consumer brand's MMM analysis shows that for every $1 spent on Google Search ads, they get $4 in return, but this return diminishes after spending $50k per month. In contrast, their podcast ads only return $2 for every $1 spent, but the return is stable up to $100k per month. This prompts them to cap their search budget at $50k and reallocate the extra funds to scale their more consistent podcast advertising.
- Multi-location Retailers: A national retail chain uses MMM and finds that their print circulars have a surprisingly high correlation with in-store sales, especially when distributed the same week as a major holiday. This data prevents them from cutting their print budget in favor of digital-only channels and helps them time their distribution for maximum impact.
- SaaS Platforms: A B2B software company's MMM shows that their investment in industry event sponsorships has a delayed but significant impact on enterprise-level demo requests three months later. While user-level attribution couldn't connect these dots, the high-level model proves the long-term ROI of the events, justifying the significant upfront cost.
Actionable Tips for Getting Started
- Gather Comprehensive Data: Collect at least 1-2 years of historical data, including weekly or monthly spend for each marketing channel, total sales revenue, website traffic, and external factors like seasonality or economic trends.
- Start with an Open-Source Model: You don’t need an expensive enterprise solution to begin. Meta's Robyn and Google's LightweightMMM are powerful open-source MMM projects that data analysts can implement to get started.
- Focus on Incremental Impact: Use the model's outputs to understand the incremental lift from each channel. The goal is to identify which channels are most efficient at generating additional sales, not just which ones have the highest spend.
- Simulate Budget Scenarios: Once your model is built, use it to run simulations. Ask questions like, "What would happen if we increased our YouTube budget by 20% and decreased our search budget by 10%?" to find your optimal mix.
Data-Driven Marketing: 10-Point Strategy Comparison
| Approach | Implementation Complexity 🔄 | Resource & Setup ⚡ | Expected Outcomes ⭐📊 | Ideal Use Cases 💡 | Key Advantages ⭐ |
|---|---|---|---|---|---|
| Predictive Analytics & Customer Segmentation | High 🔄 — ML models, data pipelines, ongoing retraining | High ⚡ — substantial historical data, engineers or SaaS; 4–8 weeks | High ⭐⭐⭐ — improved targeting, higher ROAS, churn reduction 📊 | E‑commerce, SaaS, enterprises with 12+ months of data | Scales hyper‑personalization; prioritizes high‑value audiences |
| Real‑Time ROAS Optimization & Attribution Modeling | High 🔄 — complex tracking, multi‑touch models | High ⚡ — pixels, data warehouse, attribution tools; 2–6 weeks | Very High ⭐⭐⭐ — immediate spend efficiency, measurable ROAS lifts 📊 | Omnichannel advertisers, agencies running large budgets | Eliminates wasted spend; ties revenue to touchpoints |
| Conversion Rate Optimization (CRO) & A/B Testing | Medium 🔄 — testing framework and UX changes | Medium ⚡ — tools (Optimizely/Hotjar), design/UX time; 2–6 weeks | High ⭐⭐ — conversion uplift (25–50% typical) 📊 | Sites with steady traffic (e‑commerce, SaaS landing pages) | Improves conversions without increasing traffic; compounding gains |
| Behavioral Email Sequencing & Automation | Low–Medium 🔄 — mapping triggers and sequences | Medium ⚡ — email platform + clean data; 3–4 weeks | High ⭐⭐ — strong recovery/repeat revenue; high ROI 📊 | E‑commerce, coaching, SaaS with owned email lists | Cost‑efficient revenue, automates personalization at scale |
| Geofencing & Location‑Based Targeting | Medium 🔄 — location setup, attribution linking | Medium ⚡ — DSPs/platforms, creative for mobile; 1–2 weeks | Medium ⭐ — measurable foot traffic and local conversions 📊 | Multi‑location retail, service businesses, events | Drives in‑moment action; competitor intercept campaigns |
| LTV Modeling & Unit Economics Optimization | Medium 🔄 — cohort & predictive models | Medium ⚡ — historical revenue data, analytics; 2–3 weeks | Very High ⭐⭐⭐ — informs sustainable CAC and budget strategy 📊 | Businesses focused on scaling profitably (subscriptions, DTC) | Aligns acquisition with long‑term profitability |
| Dynamic Creative Optimization (DCO) & AI Ads | Medium–High 🔄 — asset feed and algorithm tuning | Medium ⚡ — many creative assets, DCO platform; 1–2 weeks | High ⭐⭐ — faster creative wins, better CTR/conv rates 📊 | E‑commerce and high‑volume ad programs | Personalizes creative at scale; accelerates creative testing |
| Omnichannel Attribution & Journey Mapping | High 🔄 — cross‑device joins and integration | High ⚡ — first‑party IDs, analytics stack; 3–4 weeks | Very High ⭐⭐⭐ — reveals true channel roles and sequence impact 📊 | Brands running multi‑channel campaigns needing coordination | Prevents siloed decisions; optimizes channel sequencing |
| Competitive Intelligence & Market Share Analytics | Low–Medium 🔄 — tool setup and analysis cadence | Medium ⚡ — subscriptions to intel tools; 1–2 weeks initial | Medium ⭐ — faster strategy validation and gap ID 📊 | Market entry, positioning, agencies benchmarking rivals | Accelerates learning from market leaders; finds gaps |
| Marketing Mix Modeling (MMM) & Budget Optimization | High 🔄 — statistical modeling, seasonality, offline data | High ⚡ — aggregate sales data, analysts; multi‑week projects | High ⭐⭐ — optimal budget allocation across offline/online 📊 | Brands with offline channels or long purchase cycles | Quantifies channel contribution and diminishing returns |
From Data to Dollars: Making These Strategies Work for You
The journey through these ten data-driven marketing strategies reveals a fundamental shift in how businesses connect with customers. Moving beyond guesswork, we’ve seen how predictive analytics can pinpoint your next high-value client, how real-time ROAS optimization ensures every dollar is accountable, and how granular A/B testing can turn a good landing page into a great one. The common thread is clear: the most successful marketing isn't about having the most data, but about having the right data and the discipline to act on it.
This shift transforms marketing from a cost center into a predictable revenue engine. For a local service business, this might mean using geofencing to serve a timely ad to a potential customer just a few blocks away. For an e-commerce brand, it could be implementing a behavioral email sequence that recovers 15% of abandoned carts. These aren’t abstract concepts; they are concrete actions fueled by information that your business is already collecting. The power lies in translating that raw information into intelligent, automated actions that guide the customer journey.
Your Actionable Starting Point
The sheer number of possibilities can feel overwhelming, but progress doesn't require boiling the ocean. The key is to start small, build momentum, and create a culture of measurement. Instead of trying to implement all ten strategies at once, choose one that addresses your most pressing business challenge right now.
- If your ad spend feels like a black box: Start with Attribution Modeling. Focus on understanding which channels are actually driving conversions, not just clicks.
- If your website traffic is high but sales are low: Begin with Conversion Rate Optimization (CRO). A single A/B test on your product page headline or call-to-action button can yield immediate, measurable gains.
- If you struggle with customer retention: Implement Customer Lifetime Value (LTV) Modeling. Identify your most valuable customer segments and build loyalty programs or targeted campaigns specifically for them.
Each successful implementation creates a feedback loop. A CRO test provides new behavioral data. A refined attribution model helps you reallocate your budget more effectively. An LTV analysis informs your customer acquisition strategy. This iterative cycle of measure, analyze, act, and repeat is the core engine of all successful data-driven marketing strategies. It’s how you move from simply collecting data to actively using it to shape outcomes and drive profitable growth.
The ultimate goal is to build an operational rhythm where every marketing decision is backed by evidence. By embedding these practices into your workflow, you stop making assumptions and start having data-informed conversations about what your customers truly want and how you can best deliver it. This is the foundation for creating sustainable, scalable, and defensible market leadership.
Ready to turn these complex strategies into a streamlined growth machine? The team at Silver Spoon Agency specializes in orchestrating omnichannel campaigns that connect data points across the entire customer journey, from first click to final conversion. We build the data infrastructure and execute the high-ROI campaigns that turn your business information into predictable revenue. Learn how we can serve growth to you on a silver platter.