


How to Calculate Return on Ad Spend for Real-World Profit

To figure out your return on ad spend, the formula itself is refreshingly simple: Revenue from Ads ÷ Cost of Ads = ROAS. This little calculation tells you exactly how many dollars you're making for every single dollar you spend on ads. Think of it as a quick, honest health check for your advertising efforts.
What Is Return on Ad Spend?
Return on Ad Spend, or ROAS, is one of the most powerful and direct marketing metrics you can track. It cuts through the noise to measure the gross revenue generated for every dollar you put into an advertising campaign. Unlike more complicated metrics that might factor in your entire company's overhead, ROAS keeps its focus squarely on the performance of your ads.
This laser focus makes it an indispensable tool for anyone managing a marketing budget. It helps you answer the most pressing questions, fast:
- Is this particular campaign actually making money?
- Which ad channel is giving us the best bang for our buck?
- Are we putting our budget in the right places?
Let’s say you run an e-commerce store selling trendy fitness gear. You decide to pour $10,000 into a Facebook ads campaign targeting gym enthusiasts. If that campaign brings in $40,000 in sales, your ROAS is 4:1 (or 400%). Every dollar you spent brought back four. Simple as that.
When you consider the sheer scale of global ad spending, you can see why knowing this number isn't just a nice-to-have—it's critical for survival and growth. You can dive deeper into global ad spending trends to see just how massive the industry is.
Breaking Down the ROAS Formula
The beauty of the basic ROAS calculation is that there's nowhere to hide. It’s built on just two core numbers: the total cash you brought in from the ads and the total cash you spent to run them. Getting a firm grip on both is the first step to an accurate calculation.
Key Takeaway: A high ROAS means your ads are efficient and pulling in significant revenue. A low ROAS is a red flag, signaling that your campaign costs are creeping up on your returns and it’s time to optimize or rethink your strategy.
To make it even clearer, let's break down exactly what goes into this simple formula.
The Core ROAS Formula at a Glance
This table breaks down each component of the basic Return on Ad Spend calculation for easy reference.
| Component | What It Means | Example Value |
|---|---|---|
| Revenue from Ads | The total income generated directly from people who clicked on your ads and made a purchase. This is the "return" part of the equation. | $50,000 |
| Cost of Ads | The total amount you spent to run the advertising campaign. This includes your media buy on platforms like Google or Meta. | $10,000 |
| ROAS Ratio | The final result, typically expressed as a ratio (like 5:1) or a percentage (500%). It shows the revenue per dollar of ad spend. | 5:1 |
With these pieces, you have everything you need for the fundamental ROAS calculation.
A 5:1 ratio like the one in the table is generally seen as a solid performance. But what's considered "good" can vary wildly depending on your industry, profit margins, and the specific goals of your business.
Finding the Right Data for an Accurate ROAS
The ROAS formula looks simple on the surface, but its output is only as good as the numbers you feed it. Garbage in, garbage out. To get a truly accurate read on your return, you have to become a bit of a data detective, hunting down two key figures: your true ad cost and the actual revenue your ads generated.
This isn't just about pulling a couple of numbers from a dashboard. It’s about taking a holistic view of your spending and having a crystal-clear understanding of how sales are credited back to your campaigns. Getting this right is what separates a vanity metric from a real measure of profitability.
Tallying Your Total Ad Costs
Your real ad cost almost always goes beyond the media spend you see in your Google Ads or Meta Ads account. If you only count the direct platform charges, you’re going to artificially inflate your ROAS, giving yourself a dangerously misleading picture of how your campaigns are actually doing.
A complete calculation of your total ad cost needs to include:
- Platform Ad Spend: This is the obvious one—the money you pay directly to platforms like Google, Facebook, LinkedIn, or TikTok to run your ads.
- Agency or Freelancer Fees: If you’re working with an agency or a contractor, their retainer or percentage-of-spend fee is a direct cost of advertising and has to be in the mix.
- Third-Party Software Costs: Using special software for campaign management, analytics, or building creatives? A piece of those subscription fees should be allocated to your ad costs.
- Creative Production Costs: This covers expenses for graphic design, video production, copywriting, or any other content made specifically for your ad campaigns.
Let’s Look at a Real-World Example: A Local Med Spa
Imagine a med spa is running a campaign to promote a new skincare treatment. Here’s what their actual costs might look like for one month:
- Google Ads Spend: $2,500
- Meta (Facebook & Instagram) Ads Spend: $1,500
- Marketing Agency Retainer: $2,000
- Landing Page Software (e.g., Unbounce): $150
- Video Ad Production (Freelancer): $500
Their ad dashboards might only show $4,000 in ad spend. But the true total ad cost is actually $6,650. Using the smaller number would make their ROAS look over 66% higher than it really is.
Key Takeaway: Always add up all associated expenses, not just the media buy. An honest ROAS calculation absolutely requires a complete picture of your costs.
Pinpointing Your Ad-Generated Revenue
Attributing revenue is the other side of the coin, and it can be just as tricky. A customer’s journey is rarely a straight line. They might see an ad on Instagram, search for your brand on Google a week later, and finally buy after clicking a link in an email. So, which channel gets the credit?
This is where attribution models come in. By default, most ad platforms use a last-click attribution model. This gives 100% of the credit to the final ad a customer clicked before converting. While it's simple, it often completely ignores the crucial role earlier touchpoints played in building awareness and interest.
To get a clearer picture, you need to combine a few tools:
- Ad Platform Pixels: Essentials like the Meta Pixel and the Google Ads conversion tracking tag are your first line of defense for connecting ad views and clicks directly to on-site actions like purchases.
- Google Analytics 4 (GA4): GA4 offers much more advanced, data-driven attribution models. It analyzes all the touchpoints in a conversion path, giving you a more balanced view of which channels are actually contributing to sales.
- UTM Parameters: These are simple tags you add to your ad URLs (like
?utm_source=facebook&utm_medium=cpc). They allow you to precisely track the source of your traffic and conversions inside your analytics platforms.
By triangulating data from these sources, you can get much more confident about which revenue was genuinely driven by your ads. I’ve found that looking at the cost per acquisition alongside ROAS gives an even sharper view of campaign efficiency. It helps clarify not just the return you’re getting, but exactly what it costs to land each new customer.
How ROAS Works for Different Business Models
The standard ROAS formula is a great starting point—a clean, high-level look at your ad performance. But its real value shines when you start tweaking it for your specific business. After all, an e-commerce brand, a local plumber, and a SaaS company all have completely different ideas of what a "return" actually is.
Let's get practical and move past the theory. I'll walk you through a few real-world scenarios with realistic numbers. The goal here isn't just to show you the final ROAS, but to help you understand what that number truly means for different kinds of businesses.
E-Commerce: A Straight Line to Revenue
E-commerce is the cleanest example because the return is almost always a direct, trackable sale. The journey from someone clicking an ad to you seeing revenue hit your account is short and sweet, making it the perfect place to start.
Picture a direct-to-consumer brand that sells high-end coffee beans online. They decide to run a targeted Meta Ads campaign to push a new espresso blend.
Here’s how their numbers shake out for the month:
- Total Ad Spend on Meta: $5,000
- Agency Management Fee: $1,500
- Total Revenue Directly Attributed to Ads: $26,000
First things first, we need to find the true ad cost. That's not just what you paid Meta. It’s the platform spend plus any management fees.
$5,000 (Meta spend) + $1,500 (agency fee) = $6,500
Now we can plug that into our formula:
($26,000 Revenue / $6,500 Ad Cost) = 4.0
That gives them a 4:1 ROAS, or 400%. For every single dollar they put into that campaign, they got $4 back in top-line revenue. For most e-commerce brands, a 4:1 is a solid benchmark, though your actual profit depends entirely on your product margins.
Local Services: Putting a Price Tag on a Lead
If you're a local service business—think a plumber, an HVAC company, or a roofer—your goal isn't an online sale. It's a qualified lead. The "return" here isn't instant cash but the potential revenue from a booked job. This means we have to add an extra step: figuring out what a lead is actually worth.
Let's take a local plumbing company running Google Local Services Ads to get more emergency repair calls.
To calculate their ROAS, they have to work backward to find their average lead value:
- Average Job Value: They know the average emergency repair job brings in $450.
- Lead-to-Booking Rate: Their office team is great and books 1 out of every 3 qualified calls, giving them a 33% close rate.
- Average Lead Value: $450 (job value) x 0.33 (close rate) = $148.50. Each good lead is worth about $148.50 in potential work.
With that number, they can now look at their monthly ad performance:
- Total Ad Spend on Google: $3,000
- Qualified Leads Generated: 40
- Total Lead Value: 40 leads x $148.50/lead = $5,940
Now the ROAS calculation is straightforward:
($5,940 Total Lead Value / $3,000 Ad Cost) = 1.98
Their ROAS is 1.98:1, or just under 200%. This tells them that for every $1 they spend, they generate about $2 in potential revenue. The ads are definitely working, but there's probably some room to improve, either by making the ads more efficient or by increasing their booking rate.
The process flow below breaks down how ad spend is measured against the revenue it generates to give you a clear ROAS.
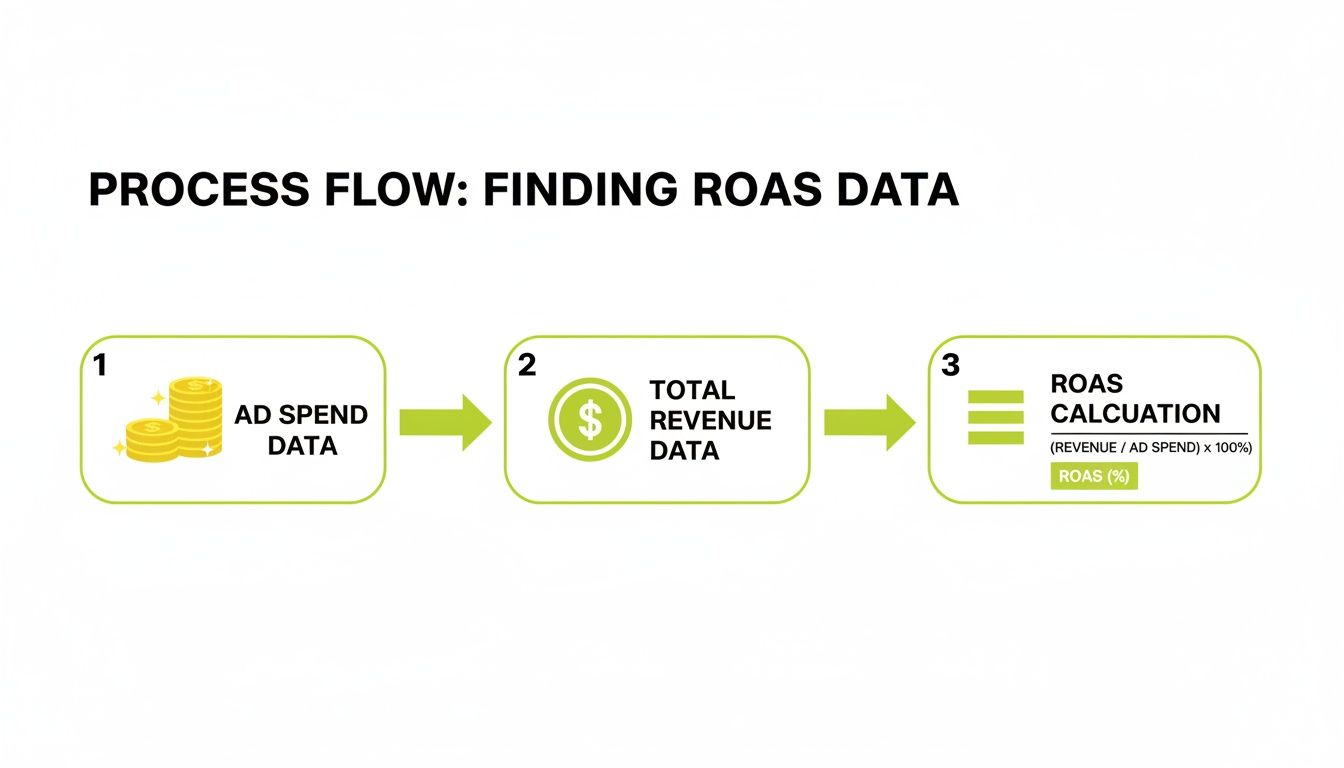
This simple visual reinforces the core idea: ROAS is just a direct comparison of what you spend versus what you earn from that spend.
B2B SaaS: Tracking Value Through a Long Sales Cycle
Figuring out ROAS for a B2B SaaS company is easily the most complex scenario. You're dealing with long sales cycles and tons of different touchpoints. A lead you generate today might not sign a contract for three, six, or even twelve months.
Because of this, B2B marketers often measure ROAS against the sales pipeline they've influenced, and they rely on much longer attribution windows.
Let's look at a project management SaaS company using LinkedIn ads to get demo requests.
- Total LinkedIn Ad Spend (Quarter): $20,000
- Marketing Team Salaries (Allocated): $10,000
- Total Ad Cost (Quarter): $30,000
Instead of looking at immediate sales, they're tracking how many new, qualified opportunities entered their sales pipeline because of the campaign.
- Demos Booked from Ads: 50
- Opportunities Created (Sales Qualified): 25
- Average Annual Contract Value (ACV): $12,000
- Total Influenced Pipeline: 25 opportunities x $12,000 ACV = $300,000
In this situation, they calculate what's called a Pipeline ROAS:
($300,000 Pipeline / $30,000 Ad Cost) = 10:1
A 10:1 Pipeline ROAS is phenomenal. It proves their marketing is efficiently creating high-value opportunities for the sales team. Sure, not every deal will close, but this metric acts as a leading indicator of future revenue. It gives them the confidence to keep investing in the ads long before the cash actually hits the bank.
Expert Insight: Calculating ROAS isn't a one-size-fits-all game. You have to adapt the definition of "return" to fit your business. For e-commerce, it's a sale. For local services, it's the value of a lead. And for B2B, it's often the value of your sales pipeline.
This flexibility is what makes ROAS such a powerful metric for everyone, from a local gym in Brazil to a global software firm. Imagine that gym spends $5,000 on geofenced ads and brings in $25,000 in new memberships—that’s a clean 5x ROAS. As global ad markets race toward $1 trillion by 2026, knowing your numbers is non-negotiable. You can find more insights on the future of global advertising from Dentsu.
Measuring True Profitability Beyond Basic ROAS
A high Return on Ad Spend (ROAS) can feel like a major victory, but it might be hiding a dangerous secret. Hitting a 4:1 ROAS looks great on a report, but if your profit margin is only 20%, you're actually losing money on every single sale.
This is where we have to look past the surface-level metrics and start measuring what really matters to your bottom line: actual profit.
Getting a grip on this difference is what separates the good marketers from the great ones. It gives you the power to make decisions that fuel sustainable growth, not just chase impressive-looking (but ultimately hollow) revenue numbers. Let's dig into a couple of more advanced ways to calculate your campaign's true financial health.
Factoring in Margins with Profit-Adjusted ROAS
The first step toward real clarity is to bring your product margins into the equation. This is often called Profit-Adjusted ROAS or sometimes Return on Marketing Investment (ROMI). Instead of just looking at total revenue, this metric zeroes in on the gross profit your ads generate.
The formula changes just slightly, but it makes a world of difference:
Profit-Adjusted ROAS = (Gross Profit from Ads – Ad Cost) / Ad Cost
Let's see how this plays out in the real world. Picture two e-commerce products, both pulling in a standard 4:1 ROAS from a $1,000 ad spend. On paper, they look identical.
- Product A (High Margin): Sells for $200 with a Cost of Goods Sold (COGS) of $40. That's a juicy 80% profit margin.
- Product B (Low Margin): Also sells for $200, but its COGS is $150. The profit margin here is a much tighter 25%.
Now, let's put them head-to-head to see what's really going on.
ROAS vs. Profit-Adjusted ROAS
This table shows exactly how two products with the same 4:1 ROAS can have wildly different impacts on your profitability, all because of their margins.
| Metric | Product A (High Margin) | Product B (Low Margin) |
|---|---|---|
| Ad Spend | $1,000 | $1,000 |
| Revenue Generated | $4,000 | $4,000 |
| Standard ROAS | 4:1 | 4:1 |
| Gross Profit | $3,200 | $1,000 |
| Net Profit | $2,200 | $0 |
| Profit-Adjusted ROAS | 2.2:1 (220%) | 0:1 (0%) |
As you can see, both products hit that "successful" 4:1 ROAS. But the story ends there. Product A banked $2,200 in net profit, while Product B just broke even. Looking beyond simple revenue gives you an honest look at whether your campaigns are actually growing the business or just spinning their wheels.
Looking Ahead with LTV-Adjusted ROAS
For any business that relies on repeat customers—think subscription services or brands with fiercely loyal followings—judging a campaign by the first sale is incredibly shortsighted. A customer you acquire today could make many more purchases over the next year.
This is where Customer Lifetime Value (LTV) becomes a game-changer.
LTV-Adjusted ROAS helps you see the long-term return from your ad spend, which can justify what might otherwise seem like a high cost to acquire a customer upfront.
LTV-Adjusted ROAS = (Customer Lifetime Value from Ads / Ad Cost)
Calculating a perfectly precise LTV can get complicated, but even a solid estimate can completely flip your perspective on a campaign's performance.
Expert Insight: Don't let a low initial ROAS scare you away from a campaign that acquires high-value, long-term customers. The real win isn't just the first sale; it's the entire stream of revenue that follows.
A SaaS Company Example
Let's say a B2B SaaS company spends $10,000 on LinkedIn ads in one month.
- The ads bring in 5 new customers.
- Each customer is on a $500 per month plan.
- So, the initial revenue for that month is just $2,500.
If they only calculated the standard ROAS for that month, it would be a disaster: 0.25:1 ($2,500 Revenue / $10,000 Cost). Based on that number alone, they'd probably kill the campaign immediately.
But they know their numbers. Their average customer sticks around for 18 months.
- Average LTV per customer: $500/month x 18 months = $9,000
- Total LTV from new customers: 5 customers x $9,000 LTV = $45,000
Now, let’s run the numbers for LTV-Adjusted ROAS:
($45,000 Total LTV / $10,000 Ad Cost) = 4.5:1
Suddenly, a 4.5:1 ROAS tells a completely different story. The campaign isn't a failure; it's a highly profitable investment in the company's long-term growth. To get this right, a solid understanding of Marketing Attribution is critical for connecting your efforts to actual sales down the line.
For more on this, check out our guide on measuring marketing effectiveness.
Actionable Strategies to Improve Your ROAS

Knowing your ROAS is one thing. Making it grow is the real game. The goal is to make every single ad dollar work harder for you, turning a campaign that’s just breaking even into a profitable one—or taking a good campaign and making it great.
This isn’t about flipping a single magic switch. It’s a systematic process of tuning up every part of your advertising engine, from who you target to what they see after they click.
Sharpen Your Audience Targeting
Wasting your ad spend on the wrong people is the number one ROAS killer. It's that simple. The more precisely you can get your ads in front of people who are genuinely interested in what you sell, the more efficient your budget becomes.
Start by digging into the data you already have. Your analytics and CRM are goldmines for building detailed profiles of your best customers. Look past the basic demographics to understand their behaviors, interests, and the actual problems you solve for them.
With that insight, you can start using more advanced targeting tactics:
- Lookalike Audiences: Platforms like Meta let you create audiences that mirror the characteristics of your highest-value customers. This is an incredibly powerful way to find new people who are statistically likely to buy from you.
- Retargeting Campaigns: Don’t let warm leads go cold. Set up campaigns that specifically chase down users who have visited your site, abandoned a cart, or engaged with your content.
- Geofencing for Local Businesses: If you run a local clinic or a retail store, geofencing is a game-changer. It lets you serve ads to people within a specific radius of your physical location, capturing high-intent foot traffic.
Optimize Your Ad Creative and Copy
Your ad creative is your digital handshake. If it doesn't immediately grab attention and communicate value, you've already lost the click and the money you spent on that impression.
Generic, uninspired ads are a fast track to low click-through rates and a ROAS that makes you wince. You need to be testing different elements constantly to see what actually connects with your audience. To really move the needle on ROAS, you have to get serious about optimizing your ads, and learning how to create video ads that convert is a fantastic starting point.
Expert Tip: Don't just test the big, obvious changes. I've seen campaigns get a huge lift from something as simple as swapping a headline, changing a button color, or using a different image. Let the data tell you what works, not your gut.
For instance, an e-commerce brand selling athletic wear could pit a dynamic video ad (showing the product in action) against a static image that features a bold discount. The results will show you which creative drives more profitable conversions, which is a direct lever on your ROAS.
Perfect the Post-Click Experience
Getting the click is only half the battle. What happens after someone clicks is just as crucial. A clunky, slow, or confusing landing page will make people bounce, completely wasting the money you spent to get them there in the first place.
Your landing page has to be a seamless extension of your ad. The messaging, the visuals, the offer—it all needs to be perfectly aligned. If your ad promises a 20% discount, that discount better be front and center the second the page loads.
Nail these key areas for a better landing page experience:
- Mobile Optimization: A massive chunk of ad traffic comes from mobile. Your page must load fast and be a breeze to navigate on a small screen. No excuses.
- Clear Call-to-Action (CTA): Be direct. Tell users exactly what you want them to do next, whether it's "Buy Now," "Book a Consultation," or "Download the Guide."
- Reduce Friction: Keep your forms short and your checkout process dead simple. Every extra step is another chance for a potential customer to give up and leave.
When you improve the conversion rate on your landing page, you're generating more revenue from the exact same number of clicks. That directly boosts your ROAS. As a bonus, a strong post-click experience can also improve your quality scores on ad platforms, which often leads to lower ad costs over time. And for more ideas, you might want to check out our guide on how to increase average order value.
Common Questions About Calculating ROAS
Even when you feel like you've got the basics down, calculating Return on Ad Spend can throw some curveballs. It’s the little details—like attribution windows or why your numbers never seem to match between platforms—that cause the most headaches and make you doubt your data.
Let's clear up a few of the most common hurdles marketers run into. Nailing these details will give you confidence in your reporting and ensure you’re making decisions based on numbers you can actually trust.
Why Do My Ad Platforms Show Different ROAS Numbers?
It’s the classic marketing migraine: Google Ads reports a fantastic 4.5:1 ROAS, but when you check Google Analytics, it’s showing a more modest 3.8:1 for the exact same campaign. What gives?
This happens all the time, and it’s because each platform is playing by a different set of rules for attribution and tracking.
- Ad Platforms (like Google or Meta): These guys tend to use a more generous attribution model. They’re quick to take credit for a sale if their ad was merely viewed or clicked at any point within a certain timeframe (their "view-through" or "click-through" window).
- Analytics Platforms (like GA4): These tools are usually more conservative, often defaulting to a last-click or data-driven model. Their goal is to show you the whole customer journey, not just give all the glory to one channel.
The thing is, neither number is technically "wrong"—they’re just telling you different parts of the same story. The best move is to pick one platform as your single source of truth for reporting. That consistency is what matters most.
How Long Should My Attribution Window Be?
An attribution window is simply the period after someone interacts with your ad during which a conversion can be credited back to it. The right length is completely dependent on how long it takes for your average customer to make a purchase.
- If you’re running an e-commerce store selling fun, low-cost items, a 7-day click and 1-day view window is probably all you need. People see it, they like it, they buy it. The decision is fast.
- But if you're a B2B SaaS company with a three-month sales cycle, you need a much longer window—think 90 days. This ensures you capture the final deal that started with an ad clicked weeks or even months ago.
If your window is too short, you’ll end up undervaluing your top-of-funnel campaigns, making them look like they aren't working when they’re actually planting the seeds for future sales.
Expert Tip: Start with your platform's default settings, but don't be afraid to tweak them. Dig into your CRM or analytics reports to find the average time between a lead's first touch and their final purchase, and adjust your window to match that reality.
Do Refunds and Canceled Orders Affect ROAS?
Absolutely, and this is a big one. Your ROAS calculation should always be based on net revenue, not gross. If you ignore returns, you’re just lying to yourself with inflated performance metrics.
Think about it this way: if your ads brought in $10,000 in gross sales, but you had $1,500 in refunds, your actual revenue from those ads is only $8,500. Using that lower number is the only way to get a true, honest picture of whether your campaigns are actually profitable.
Make it a habit to regularly update your reports by subtracting the value of returned products or canceled services from your revenue totals. This discipline is what separates fuzzy metrics from real-world financial results.
Ready to stop guessing and start seeing real, measurable growth from your advertising? The experts at Silver Spoon Agency use an AI-powered, omnichannel approach to turn ad spend into predictable revenue. We build conversion-optimized funnels and data-driven campaigns that deliver an average 4X ROAS for our clients. Book a discovery call today and let's build a strategy that drives your bottom line.