


What Is Return On Ad Spend A Complete Guide

If you're spending money on advertising, there's one question that trumps all others: Is it actually working?
You can get lost in a sea of metrics like clicks, impressions, and engagement rates, but those numbers don't pay the bills. That’s where Return on Ad Spend (ROAS) comes in. Think of it as the ultimate scorecard for your marketing campaigns.
The Ultimate Scorecard for Your Ad Campaigns

Imagine your advertising budget is the fuel for your business’s growth engine. If that’s the case, ROAS is the gauge on your dashboard telling you exactly how much mileage you're getting. It cuts straight to the point, answering the one question that truly matters: is my advertising profitable?
This isn't just some abstract number for a spreadsheet. It’s a direct, unfiltered connection between what you spend on ads and the sales that come back. For any business serious about sustainable growth, understanding ROAS isn't just a good idea—it's non-negotiable.
How ROAS Works in Practice
At its core, the concept is refreshingly simple. ROAS just compares the money you made from your ads to the money you spent to run them. The result is a simple ratio that tells the whole story.
Let's say an e-commerce store sells custom-printed t-shirts. They spend $1,000 on a Google Shopping campaign during a holiday weekend. That campaign brings in $5,000 in new t-shirt sales. Their ROAS is 5:1. Plain and simple, for every dollar they put into that ad campaign, they got five dollars back in revenue.
This kind of clear feedback loop is exactly what you need to make smart, confident decisions instead of just guessing which campaigns are pulling their weight.
To help you quickly see how these numbers play out, here’s a quick-glance table.
ROAS at a Glance Quick Examples
| ROAS Ratio | Revenue per $1 Ad Spend | Business Outcome |
|---|---|---|
| 1:1 | $1.00 | Break-even Point: You're getting back exactly what you spent. Not profitable yet. |
| 3:1 | $3.00 | Getting Healthy: A common target for many businesses, often indicating profitability. |
| 5:1 | $5.00 | Strong Performance: The campaign is a solid revenue driver. Time to consider scaling. |
| 10:1 | $10.00 | Exceptional Results: This is a high-performing campaign that's knocking it out of the park. |
As you can see, the higher the ratio, the more efficient your ad spend is at generating revenue.
Why Every Business Needs to Track ROAS
Whether you're a local plumber, a SaaS company, or a national retailer, ROAS delivers the financial clarity you need to scale your advertising with confidence. It helps you:
- Pinpoint Your Winners: Instantly see which ads, audiences, and platforms are your top performers so you can double down on what works.
- Cut Your Losses: Identify underperforming campaigns that are just wasting money and either fix them or shut them down.
- Justify Your Marketing Budget: Show stakeholders clear, data-backed evidence of how advertising directly contributes to the bottom line.
Here’s a real-world scenario. A mobile app company selling a language-learning subscription spends $20,000 on Google Ads targeting keywords like "learn Spanish app" and another $10,000 on social media campaigns showing video testimonials. The Google ads generated $120,000 in revenue, delivering a fantastic 6:1 ROAS ($6 back for every $1 spent). Meanwhile, social media brought in $30,000 for a solid 3:1 ROAS.
This data immediately tells them where their most profitable opportunities are. To learn more about putting these kinds of numbers to work, check out our guide on measuring marketing effectiveness.
How to Calculate ROAS (With Real-World Examples)
Knowing what ROAS means is one thing, but actually calculating it for your own business—that's where the rubber meets the road. The formula itself looks simple, but the two main ingredients, revenue and cost, have more nuance than you'd think.
Let's walk through it.
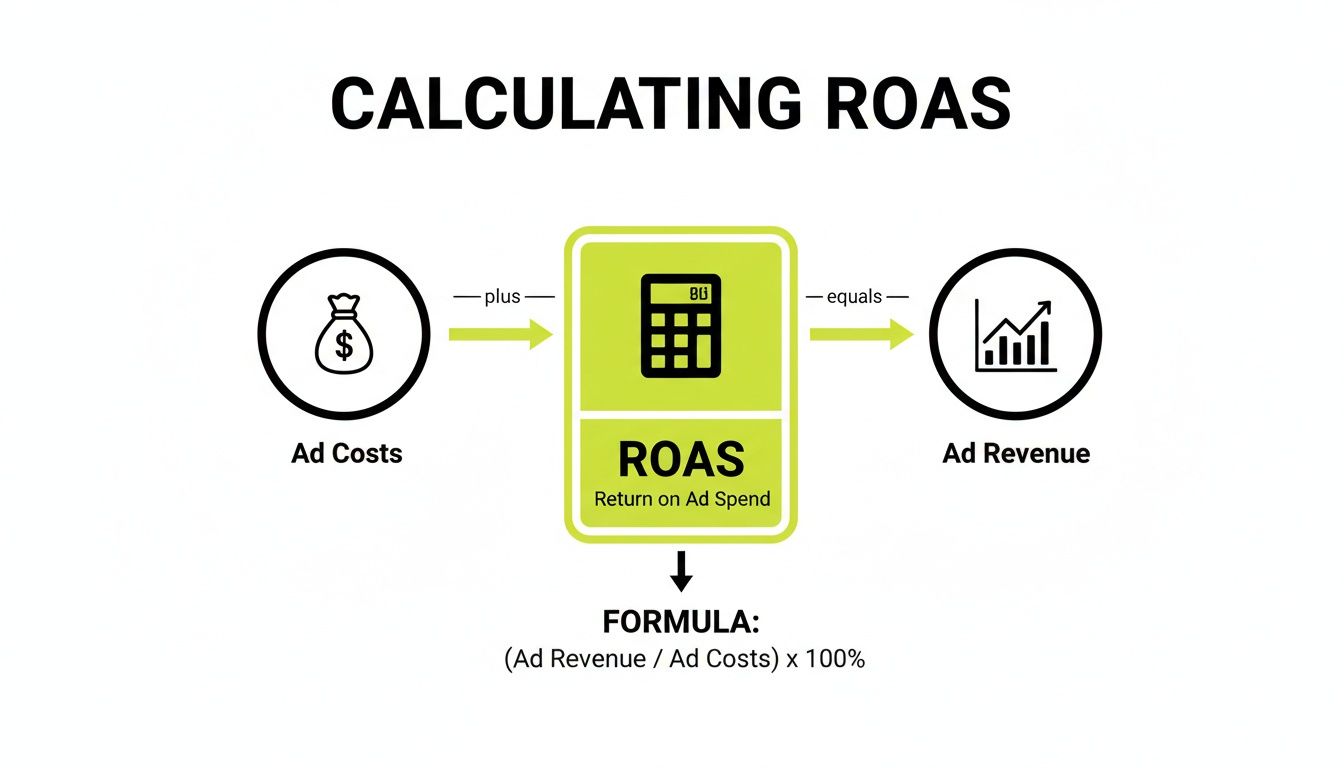
The core formula never changes:
ROAS = Total Revenue from Ads / Total Cost of Ads
The number you get back is a multiplier. If your ROAS is 5:1 (or just 5), it means for every $1 you put into your advertising, you got $5 back in revenue. Simple as that.
Nailing Down Your Ad Revenue and Costs
Before you start plugging numbers into a calculator, you have to be crystal clear on what counts. Revenue from Ads is the total sales value that you can directly attribute to a specific ad campaign. Most platforms like Google Ads and Meta Ads handle this for you with their conversion tracking pixels, but it’s on you to make sure that tracking is set up correctly.
Total Cost of Ads is where a lot of businesses trip up. It's not just what you paid for the clicks. To get a real, honest ROAS, you have to factor in all the associated expenses.
Your ad costs should always include:
- Ad Spend: The money paid directly to the platform (Google, Meta, TikTok, etc.).
- Agency or Management Fees: If you have an agency or a freelancer running your campaigns, their fee is a direct cost.
- Creative Production: The money spent on video production, graphic design, or copywriting for the ads.
- Software and Tools: The subscription costs for any third-party tools used to manage, create, or analyze your ads.
If you skip these extra costs, you’ll end up with an inflated ROAS that looks great on paper but will lead you to make some really bad budget decisions down the line.
E-Commerce Example: A Simple Calculation
Let's kick things off with a classic e-commerce business. Imagine a company selling handcrafted leather wallets decides to run a Facebook ad campaign.
- Total Sales from Campaign: The ads brought in $8,000 in direct wallet sales.
- Facebook Ad Spend: They spent $1,500 on Facebook's platform.
- Video Ad Creative: They hired a videographer for $500 to shoot the ad.
Now, let's figure out their true ROAS:
- Calculate Total Ad Cost: $1,500 (Ad Spend) + $500 (Creative) = $2,000
- Calculate ROAS: $8,000 (Revenue) / $2,000 (Total Cost) = 4
Their ROAS is 4:1. For every single dollar they invested in the entire campaign effort, they got four dollars back. That’s a solid, profitable return.
Service Business Example: A Local Gym
Figuring out ROAS for a service business can feel a bit trickier, mainly because a "sale" isn't always an instant online purchase. The trick is to assign a real monetary value to each new customer you acquire.
Let's say a local gym runs a Google Ads campaign to sign up new members.
- New Members from Ads: The campaign successfully generated 20 new sign-ups.
- Membership Value: Each new member is on a $50/month plan. To get a starting revenue figure, let's use a 3-month commitment: 20 members x ($50/month x 3 months) = $3,000.
- Google Ads Spend: They spent $400.
- Agency Fee: They pay a marketing agency $350/month to manage their campaigns.
Let's run the numbers for one month's campaign:
- Calculate Total Ad Cost: $400 (Ad Spend) + $350 (Agency Fee) = $750
- Calculate ROAS: $3,000 (Revenue) / $750 (Total Cost) = 4
The gym’s ROAS is also 4:1. This calculation gives them a clear, immediate picture of whether their ad strategy is actually turning clicks into paying members. Once they understand what return on ad spend is in their specific context, they can invest confidently in the campaigns that fill their classes.
ROAS vs. ROI, CPA, and LTV: What's the Real Story?
A high Return on Ad Spend (ROAS) can feel like a huge win, and it's easy to get excited about a 5:1 or 10:1 return. But here’s the thing: ROAS doesn't tell the whole story. If your profit margins are thin, that impressive number might be hiding the fact that you're actually losing money.
To really get a grip on your ad performance, you need to look at ROAS alongside a few other key players. Think of ROAS as your car's top speed—it's exciting, but it says nothing about your fuel efficiency (profit) or how much it costs to fill up the tank (customer acquisition cost).
That's where metrics like ROI, CPA, and LTV come in. They give you the complete picture.
ROAS vs. ROI: Revenue Is Great, But Profit Is Everything
The most common mix-up is between ROAS and Return on Investment (ROI). They sound alike, but they measure two completely different things: gross revenue versus net profit.
- ROAS is all about the top-line revenue your ads generate for every dollar you spend. It’s a straightforward measure of campaign efficiency.
- ROI dives deeper, measuring the actual profit you make after all your costs are accounted for—not just ad spend, but production, shipping, salaries, the works.
Let's walk through a practical example. Say you sell a product for $100.
Your cost to make and ship it (Cost of Goods Sold) is $70, which leaves you with a $30 profit margin. To get one sale, you spend $20 on ads.
On the surface, your ROAS is 5:1 ($100 Revenue / $20 Ad Cost). Looks amazing, right?
But your ROI paints a different picture. Your actual profit is just $10 ($30 Margin – $20 Ad Cost). So, your ROI on that ad spend is only 50% ($10 Profit / $20 Ad Cost).
A high ROAS is a fantastic starting point, but it's not the finish line. Without healthy profit margins behind it, it’s just a vanity metric.
ROAS and CPA: How Much Are You Paying for a Customer?
Next up is Cost Per Acquisition (CPA), which simply tells you how much it costs, on average, to get one new customer. While ROAS looks at the return, CPA looks at the cost. They're two sides of the same coin.
A low CPA is usually what you want, but it's meaningless without knowing how much that new customer actually spends. For a deeper dive, check out our guide on what cost per acquisition is and how to bring it down.
Imagine a direct-to-consumer coffee brand running two different campaigns:
- Campaign A (Targeting "Gourmet Coffee"): You spend $500 and get 10 customers. Your CPA is $50. Each of those customers spends $250 on premium beans, giving you a 5:1 ROAS.
- Campaign B (Targeting "Cheap Coffee Pods"): You spend $500 and get 25 customers. Your CPA is $20. But each customer only spends $40 on a single box of pods, resulting in a 2:1 ROAS.
Campaign B’s lower CPA looks more efficient at first glance, but Campaign A delivered way more revenue and a much better ROAS. You have to look at them together to know what's really working.
ROAS and LTV: Playing the Long Game
Finally, we have Lifetime Value (LTV), which estimates the total profit you'll make from a customer over their entire relationship with your business. This is where strategic thinking really pays off, because it forces you to look beyond that first sale.
A campaign might have a terrible initial ROAS but bring in customers who stick around and buy again and again. This is super common for subscription businesses or brands with high repeat purchase rates.
Let's look at a subscription box company that sells grooming products:
- Ad Spend: $1,000 on an Instagram campaign.
- New Subscribers: 20 new people sign up.
- First-Month Revenue: Each subscriber pays $30, for a total of $600.
- Initial ROAS: A dismal 0.6:1 ($600 Revenue / $1,000 Ad Spend). Looks like a total failure.
But hold on. What if your average subscriber stays for 12 months? The LTV for each customer is now $360 ($30/month x 12 months), and the total revenue from those 20 customers climbs to $7,200.
Suddenly, your long-term ROAS is a whopping 7.2:1 ($7,200 Revenue / $1,000 Ad Spend). The campaign that looked like a money pit is actually a huge winner. Understanding LTV lets you make smarter, more patient investments in acquiring the right kind of customers.
Key Marketing Metrics Compared
To make things crystal clear, here’s a quick-glance table comparing these essential metrics. Each one gives you a different piece of the puzzle, and a truly successful strategy needs all of them.
| Metric | What It Measures | Formula | Primary Use Case |
|---|---|---|---|
| ROAS | Gross revenue generated from ad spend. | (Total Revenue from Ads / Ad Spend) | Quickly assessing the top-line efficiency and revenue generation of ad campaigns. |
| ROI | Net profit from a total investment, including all costs. | (Net Profit / Total Investment) x 100 | Evaluating the overall profitability of a marketing initiative or business. |
| CPA | The average cost to acquire one new customer. | (Total Ad Spend / Number of Conversions) | Measuring the cost-effectiveness of customer acquisition campaigns. |
| LTV | The total predicted profit from a single customer over time. | (Avg. Sale x # of Repeat Sales x Avg. Time) | Informing long-term ad spend decisions and customer retention strategies. |
Looking at these metrics in isolation is a recipe for disaster. A high ROAS with a negative ROI means you're losing money on every sale. A low CPA is useless if those customers have zero LTV. The real magic happens when you use these metrics together to get a 360-degree view of your business health.
Finding Your Target ROAS in Different Industries
One of the first questions I always get from new clients is, "So, what's a good ROAS?" The honest answer is simple but a little frustrating: it completely depends.
A “good” Return on Ad Spend isn’t some universal number you can pull from a blog post. It's a deeply personal figure that hinges almost entirely on your business model and—most importantly—your profit margins. A 4:1 ROAS could be a home run for one company but a total disaster for another. The context is everything.
Without a firm grip on your margins, you're essentially flying blind, chasing a metric that might not even be making you any real money.
Key Takeaway: Your target ROAS is not an industry benchmark. It's the specific number your business needs to hit to be profitable after factoring in all your costs.
This is why a business with high margins, like a software company selling a project management tool or an expert selling digital courses, can do just fine with a lower ROAS. If their profit margin on a sale is 80%, a 3:1 ROAS means they're printing money.
But for a low-margin retailer selling physical goods with only a 20% margin, they might need an 8:1 or even 10:1 ROAS just to break even after covering ad spend.
E-Commerce ROAS Benchmarks and Goals
For anyone in e-commerce, ROAS is practically a way of life. Margins can be all over the map, from high-end custom jewelry to dropshipped phone cases. This makes a one-size-fits-all benchmark totally useless.
That said, a common baseline target for many e-commerce brands is a 4:1 ROAS. This ratio often leaves enough room to cover the cost of goods, the ad spend itself, and other operational costs like shipping and payment processing, all while leaving a healthy profit.
- Low-Margin Retail (think consumer electronics): A business selling laptops with a 15% margin often needs a sky-high ROAS, sometimes 8:1 or more, just to make a profit. Their game is all about volume and razor-thin efficiency.
- High-Margin Retail (luxury goods, digital products): A brand selling handmade leather bags with a 60% margin can be incredibly profitable at a 3:1 or 4:1 ROAS because their cost of goods is a much smaller piece of the final sale price.
To get a better handle on setting realistic ad goals, it helps to understand how ROAS fits into broader market shifts, like the latest e-commerce trends.
Professional and Local Service Businesses
Figuring out the 'R' (Return) in ROAS works a bit differently for service-based businesses like consultants, law firms, or local plumbers. You aren't selling a physical product; you're acquiring a client whose value grows over time. The real key here is understanding your client's lifetime value (LTV).
For example, a marketing consultant might spend $1,000 on LinkedIn ads to land a new client who signs a $5,000 project retainer. The initial ROAS is a solid 5:1. But what if that client loves the work and sticks around for a six-month contract? The total revenue from that one acquisition just jumped to $30,000, and the long-term ROAS skyrockets to a massive 30:1.
- Local Services (HVAC, dentists, roofers): These businesses are usually focused on lead generation. A 3:1 or 4:1 ROAS on the first service call can be a huge win, especially when you consider the potential for repeat business and referrals down the line.
- High-Ticket Services (agencies, financial advisors): With much higher client values, these businesses can succeed with a lower initial ROAS—sometimes even a 2:1—knowing the long-term payoff will be substantial.
This focus on efficiency is more critical than ever. With global ad spend blowing past $1 trillion, mastering ROAS is no longer optional for businesses running ads across multiple channels. Digital advertising has been the main driver, with total ad spend hitting nearly $1.1 trillion after a 7.3% jump, and digital formats have made up over 50% of that growth since 2019. You can read more about these global ad spend figures on warc.com.
Proven Strategies to Improve Your Return On Ad Spend

Knowing your ROAS is the first step. Actually improving it is where the real growth happens.
A low ROAS isn’t a dead end; it’s a signal to get smarter with your strategy. With a few targeted adjustments, you can turn an underperforming campaign into a powerful revenue engine. The goal isn't just to spend less—it's to make every dollar you spend work much, much harder.
It all boils down to a few core areas: who you're talking to, what you're saying, and what happens after they click.
Sharpen Your Audience Targeting
The fastest way to burn through an ad budget is to show your ads to the wrong people. Simple as that. The more precisely you can define your audience, the higher your chances of getting a conversion and watching your ROAS climb.
Don't just scratch the surface with broad demographic data. Platforms like Google and Meta have incredibly powerful tools—use them.
- Lookalike Audiences: Upload a list of your best customers (the ones who spend the most or buy most often). The ad platform’s algorithm will then hunt down new users who share similar characteristics. It's like creating a clone of your perfect customer.
- In-Market Segments: In Google Ads, this lets you target users who are right now actively researching and showing buying signals for products or services just like yours. For example, you can target people actively searching for "new homeowner mortgage rates."
- Retargeting Lists: These are your warm leads. A practical example is showing a special "10% off" ad to people who added an item to their cart in the last 7 days but didn't check out. They already know you, which often makes them the easiest and most profitable group to convert.
Relentlessly Test Your Ad Creatives
Your ad creative—the image, the video, the copy—is your first and only shot at grabbing someone's attention in a crowded feed. A small tweak to a headline or a different background color in an image can have a massive impact on your click-through and conversion rates.
This is where split testing, or A/B testing, becomes your best friend. Stop guessing what will work and let the data tell you.
Create two or more versions of a Facebook ad, but only change one single element at a time. For instance, use the exact same image and audience, but test two different headlines: "Shop Our Summer Sale" vs. "50% Off All Dresses – This Week Only!" Run them at the same time to see which one performs better, then put your budget behind the winner.
This process never stops. Once you find a winning headline, test a new image. Once you have a winning image, test a new ad format. Continuous testing is the secret to always optimizing for the best possible performance.
Optimize Your Landing Page Experience
Think of it this way: your ad’s job is to get the click. Your landing page’s job is to get the conversion. If there's a disconnect between the two, your ROAS will tank, no matter how amazing your ads are.
A seamless transition from ad to landing page is non-negotiable.
Your landing page must directly reflect the promise you made in the ad. If your ad promotes a 20% discount on running shoes, the landing page better feature that same offer and those same shoes, front and center. Any friction, like making the user search for the discounted item, will kill your conversion rate.
For example, implementing a strong Amazon CRO Strategy can directly boost ROAS by turning more ad-driven traffic into profitable sales. The same conversion rate optimization principles apply to any landing page you build.
This is the practical math that turns ad budgets into business fuel. A drop in social media CPMs, for instance, can create better efficiency for advertisers laser-focused on ROAS. While search impressions might dip, gains in click-through rates can help preserve your performance. For many small businesses, this means mastering an omnichannel approach by putting budget toward high-performers, like a Google Ads campaign that delivers a 6:1 ROAS over a channel that only brings back 3:1.
Employ Smarter Bidding Strategies
Don't just set your budget and cross your fingers. Modern ad platforms offer sophisticated, automated bidding strategies designed to help you hit specific goals—which directly translates to a better ROAS.
Instead of just bidding for clicks (CPC), it's time to use strategies that optimize for actions closer to your bottom line.
- Target ROAS (tROAS): You tell the platform the exact ROAS you want to achieve (e.g., 500% or 5:1), and its AI will automatically adjust your bids in real-time to try and hit that target. This is a game-changer for e-commerce businesses with clear revenue goals.
- Maximize Conversion Value: This strategy tells the platform to get the highest possible revenue from your budget, period. It automatically focuses on attracting higher-value customers, even if it means fewer individual conversions.
- Enhanced Cost Per Click (eCPC): This is a great hybrid strategy. You set your bids manually, but you give the platform permission to automatically raise or lower them if it thinks a specific click is more or less likely to convert.
Improving your ROAS is a continuous cycle of testing, learning, and refining. You can learn more about turning these strategies into profit by reading our detailed guide on how to improve marketing ROI.
Frequently Asked Questions
Here are some of the most common questions that pop up once you start digging into Return On Ad Spend. Getting these concepts down is the key to using ROAS to make real, profitable decisions for your business.
How Often Should I Check My ROAS?
It’s incredibly tempting to refresh your ad dashboard every hour, but that’s a great way to drive yourself crazy. Daily numbers swing wildly and a single slow day doesn't mean a campaign is failing.
For live campaigns, a quick daily check-in is fine just to make sure nothing is technically broken. But for real analysis, you need to look at performance over a 7 to 14-day window. That’s enough time to see genuine trends and make smart calls. For bigger-picture strategy, zoom out and review your ROAS weekly and monthly.
Can I Have a Good ROAS and Still Lose Money?
Yes, absolutely—and this is the single most important thing to get right. ROAS only tracks gross revenue, not profit. If you don’t have a firm grip on your profit margins, a "good" ROAS can easily trick you into losing money on every single sale.
For example, let's say your business runs on a 30% profit margin. To cover your ad costs and the cost of the goods you sold, you'd need a ROAS of at least 3.34:1 just to break even. Anything less, and you're paying to give your products away. Always, always calculate your break-even ROAS first.
What Are the Best Tools for Tracking ROAS Accurately?
Getting clean data is everything. The good news is you can get started with the tools you’re probably already using.
- Platform Analytics: This is your ground zero. The dashboards inside Google Ads and Meta Ads Manager are your primary source of truth for ad-level performance.
- Website Analytics: A tool like Google Analytics 4 is essential for connecting the dots between an ad click and what a user actually does on your site.
- E-commerce Platforms: If you’re on a platform like Shopify, its built-in sales and marketing reports are fantastic for tying revenue directly back to its source.
As you scale, many businesses start using third-party attribution tools to get a clearer, cross-channel view of the entire customer journey.
What's the Difference Between Campaign ROAS and Total ROAS?
Understanding this distinction helps you see the forest and the trees. Campaign ROAS is granular. It measures the return from one specific ad campaign, which is perfect for making tactical decisions. It tells you whether to scale up a winning ad set or kill a poor performer.
Total ROAS, on the other hand, is your 30,000-foot view. Often called Marketing Efficiency Ratio (MER) or Blended ROAS, it compares your total business revenue to your total ad spend across every channel. This number tells you about the overall health of your advertising engine and its real impact on the bottom line.
At Silver Spoon Agency, we specialize in turning advertising into measurable, revenue-producing growth. If you want to move beyond guesswork and achieve predictable ROAS, let's talk. Learn how our data-driven approach can scale your business at https://www.silverspoonagency.com.